Air is just another metric
What's the least-monitored system in your company? For us, it was our offices or more precisely, the air in them. Turns out air behaves just like the systems we already monitor: it degrades quietly, and without a metric, you're left guessing.
Observability
Observability sits at the core of everything we run. If something matters, it gets an objective metric, a dashboard and an alert.
That goes beyond the obvious techie metrics. CPU, memory, disk and latency matter, but so do sales pipelines, webshop orders or air quality. It's not about having fancy dashboards, but about real insight:
- Understand how your business operates, not how you assume it does.
- Detect where things start to drift, long before they break.
- Verify whether a change made things better, or just different.
- Decide what challenge to tackle next, backed by numbers instead of the loudest opinion.
Objectivity
We realised the real enemy of good decisions isn't missing data: it's subjectivity.
«The site seems slow», «sales look fine to me» or «the new feature feels right». Three people, three feelings, three different conclusions, and not a fact in sight.
From a quote often attributed to Peter Drucker we know:
If you can’t measure it, you can’t manage it.
«It's stuffy in here» is a hunch, but «1400 ppm CO2» is a fact.
That's the power of objectivity. Objective facts can be compared, tracked and acted on, while subjective feelings can only be argued about. Once everyone sees the same number, the discussion shifts from who's right to what to do.
Foundation
None of this works without a solid foundation, an observability stack that doesn't care what it measures.
Ours is built on open standards that play well together:
- Grafana Alloy collects
- Prometheus stores metrics
- Loki stores logs
- Grafana turns it all into dashboards and alerts
The beauty of such a stack is its extensibility. A server, a container, a webshop or a CO2 sensor: if it can expose a metric, it can join and be observed. Adding a new source doesn't mean adding a new tool. It just means adding a new scrape target.
The regularly underestimated part is labelling. Labels define how you'll slice, group and alert on your data later. This must be a process and design decision, not an afterthought.
«We'll clean up the labels later»: nobody, ever, actually did. There's an old saying:
Procrastination is the art of keeping up with yesterday.
Your labels don't have a yesterday yet, and that's a good thing.
Stakeholders
Monitoring rarely has a single owner. The infrastructure team watches servers, the developers watch their applications and sales watches the pipeline. At least if anyone thought to ask.
Each of them reaches for the tool they know, and that's how organisations end up with five monitoring solutions, three alerting tools and zero shared view of the whole.
That's a problem the moment something crosses a boundary. A slow checkout could be the database, the network or a flaky third-party API. If each team only sees their own island, nobody sees the whole picture and everyone points at someone else's dashboard.
The fix isn't picking the best tool per team, but establishing one standard for the whole organisation. One stack, one set of conventions, one place everyone looks. So a new stakeholder plugs into what already exists, instead of building yet another island.
For this to work, the whole organisation needs to play by the same rules: shared labelling, a common metrics format, one place where data lands, no matter who produces it.
Visualisation and alerts
A metric nobody looks at might as well not exist. Collecting the data is only half the job. The other half is getting it in front of the right eyes: as a dashboard when someone chooses to look and as an alert when they shouldn't have to.
That's where most dashboards and alerts fail. It's tempting to clone the last dashboard, copy an alert threshold from another system, and call it done. But a copy-pasted panel or rule most likely answers someone else's question, not yours.
Both start with the same question, not a template: what do you need to know, and what should happen the moment it goes wrong?
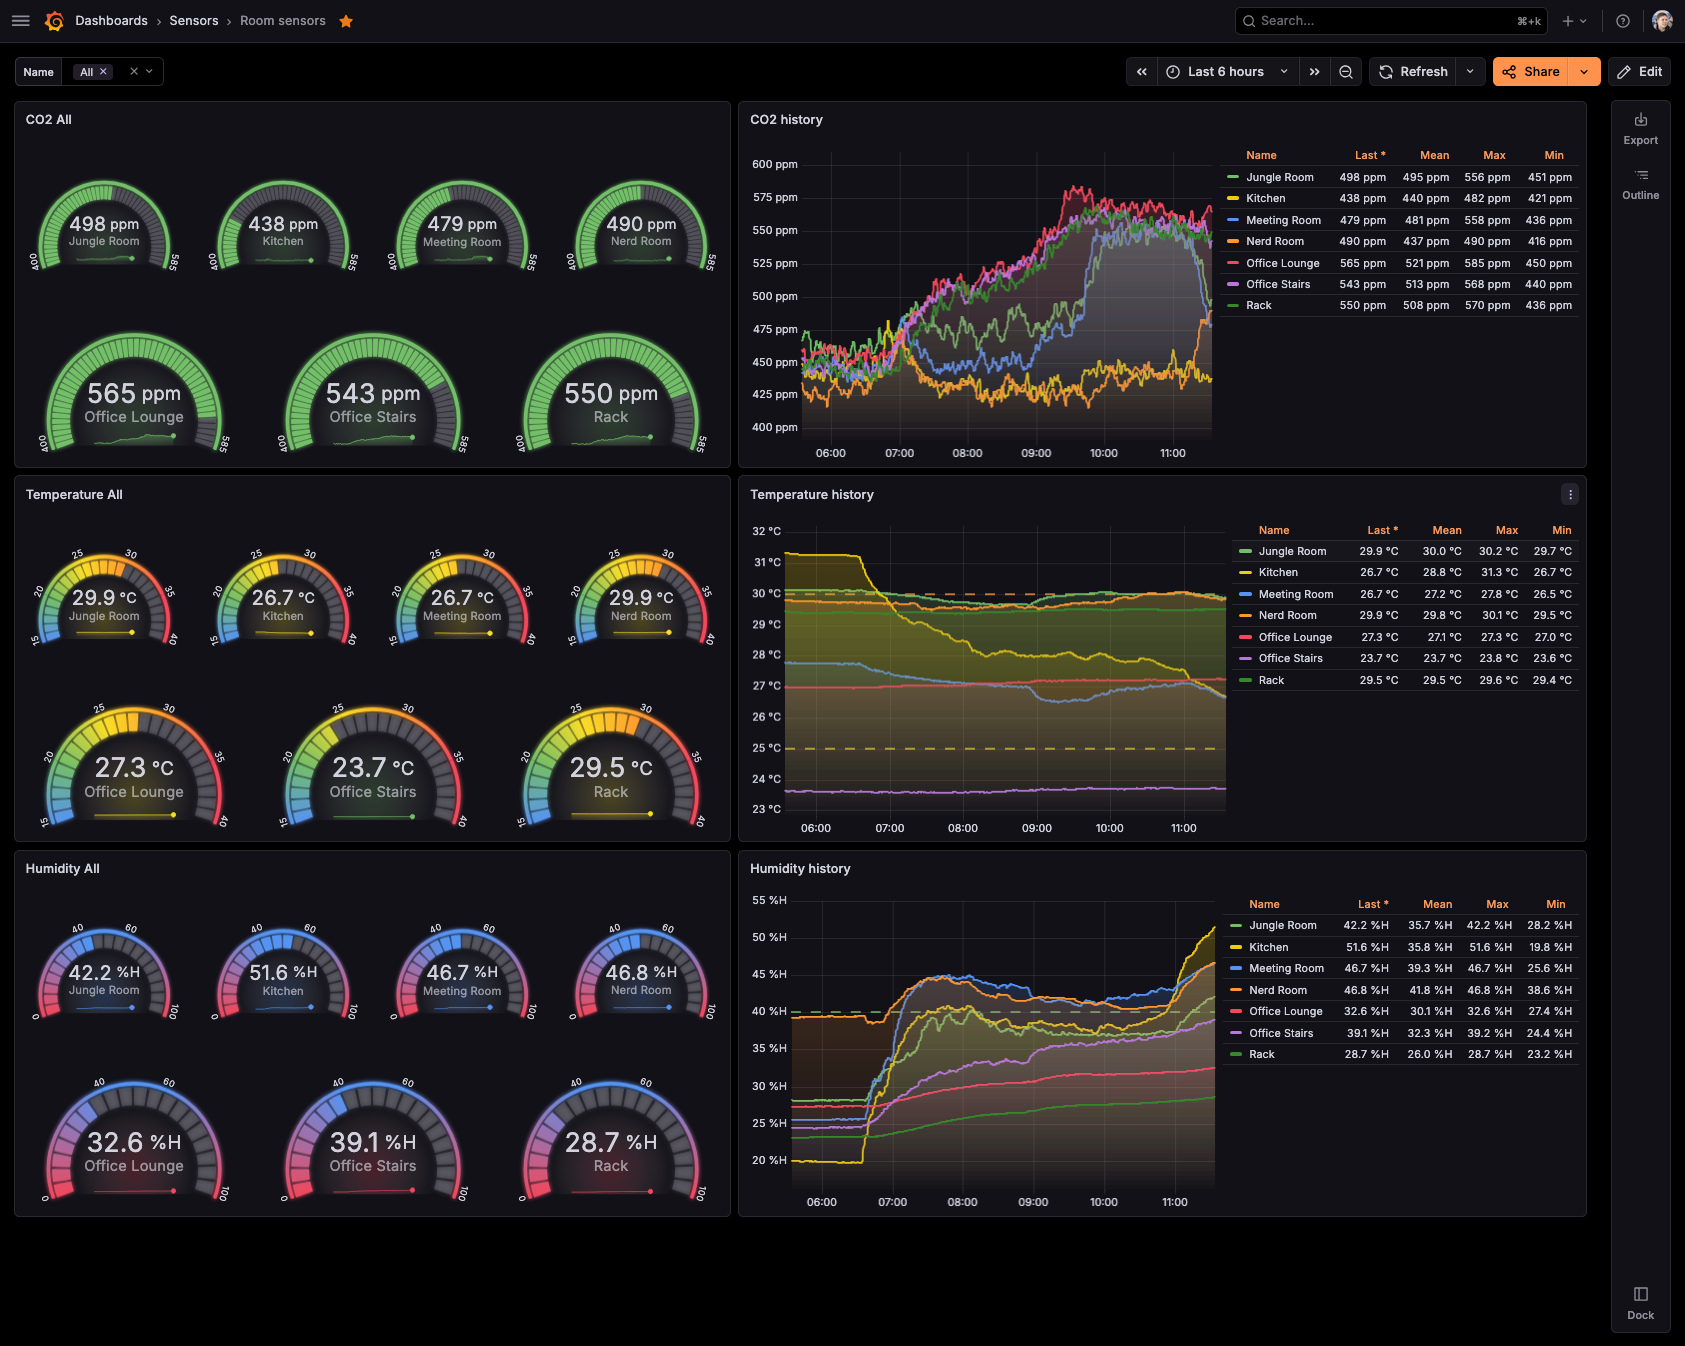
CO2 in ppm means nothing to most people, but a gauge that turns from green to red at 1500 ppm means «that's bad». An alert goes one step further: instead of waiting for you to look, it tells you «open a window» before you even think to check.
Build for the value that matters, not the panel or rule that was easiest to copy.
Build your own
The office air quality is just a small example of a big principle. It lives on the same monitoring stack as the servers. Not because CO2 is exciting, but because a single view beats five better ones nobody can compare.
We built our own sensors to get there: an ESP32-C3 with a Sensirion SCD41, a small OLED display, and a 3D-printed case we designed ourselves.
No cloud subscription, no vendor app.
The device exposes a /metrics endpoint directly, so it scrapes into our stack like any other target.
Everything is open source and documented in our CO2 sensors GitHub repository: firmware, case files, wiring and the dashboard itself.
If your servers are already monitored and only your meeting rooms aren't, that repo is all you need. If your servers and services could use the same rigour, that's what our monitoring service is for.
This insight was drafted by a real human, polished by AI, and double-checked by another human. The last word always goes to someone who drinks coffee. (The AI wanted this footnote removed.)
You might also like:
Meet TINO